Example Plan
Here's an example to help you out!
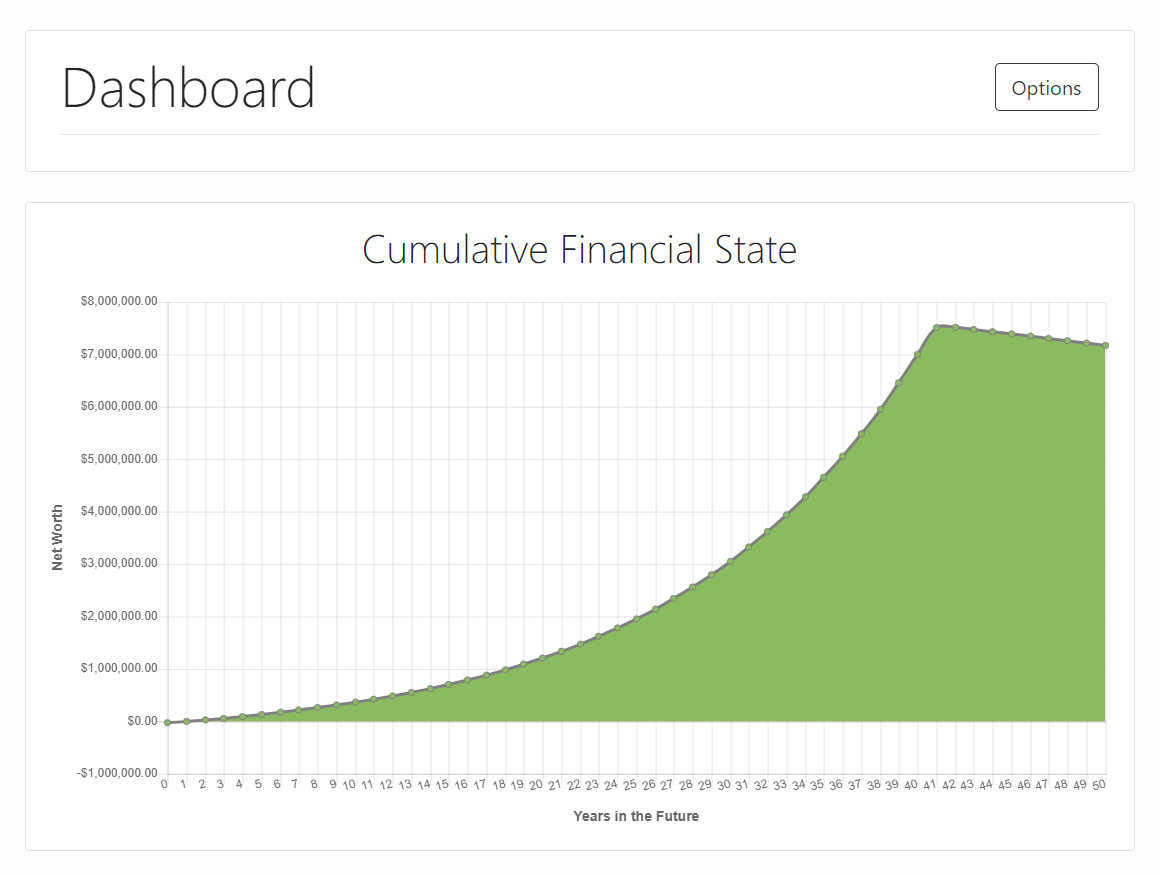

Purpose
The dashboard exists to show your cumulative financial state at a given time. Using these charts, you can test ideas to optimize your liabilities/assets and create a sustainable long-term financial plan.
Direction
The purpose can be accomplished in any manner you desire. The general method of creating your plan involves maximizing your current/future net worth & pleasure while keeping a positive net income.
Assets

-
Car
Since this particular plan is built from the perspective of someone just graduating college, this purchase would be their first car. It has a $14,000 value, and like most cars, compound depreciates for ~50% of its value over the next 5 years. It is then divested 7 years later. It had a $1,400 initial down-payment (represented in expenses), and the rest of the $12,600 was financed at 4.1% (represented in debts).
-
Savings
Both liquid and non-liquid assets are acceptable in Assets. This individual happened to have $2,000 sitting around (in a non-returning account). If the account, for example, appreciated 1%, the rate would be 1% and the span would be left blank (blank means the value changes until divested)
Incomes

-
Job
This user has a job of 'Engineer 1' with a base income of $65,000. Since income on this site is taken after tax, $49,000 is put into the entry field. They start working on 6/2019 and expect an annual raise of a compounding 1.3%. After 38 years, they expect to retire.
-
401k Match
In addition to their base income, this engineer expects a 6% employer 401k match that starts a year after work begins. This is considered an income since it is a free Investment. All investment commits are considered Expenses, so this income offsets that.
-
Other
If this worker expected to receive a pension, they would represent that as an income that starts after retirement. If they wanted to include their Social Security income, that could also be represented in the same way.
Investments

-
401k Roth
This entry is split into two parts, the initial '401k Roth' contribution for $12,000 a year, and the second '401k Roth Contin.' contribution of $2,000 more a year. Since this engineer has quite a few initial expenses, they couldn't afford to contribute the full $14,000 their first year. Thus, they split the contribution up into two parts. Because both these entries are for the same investment, they both raise at the same rate & end on the same date.
-
Employer 401k Match
This is a bit confusing since our system doesn't allow for commits to raise at a particular rate right now. Since the Income 401k Match raises at an annual compounding 1.3%, This entry had to be split into 3 parts to 'chase' that rate. 'Employer 401k Match' is the initial 6% contribution. '401k Match Contin.' takes place 11 years later when the employer match income has risen by ~$400. '401k Match Contin. 2' takes place 10 years after that when it has increased another $700. Obviously this method isn't perfect, but it is a fair approximation.
Debts

-
First Car
This entry represents the debt taken on when financing their first car. It's financed at an annually compounding 4.1% and the user decided to commit $5,000 yearly to pay off the debt. Since the debt chart doesn't increase into infinity, this was clearly enough to pay off the car.
-
College
This entry represents the student loan debt taken on by the user. The 'start commit' date is after the 'start date' because the user doesn't expect to start work until a month after graduation. The user decided to commit $9,000 yearly to this debt, which was shown to pay it off quickly.
-
Family Debt
This is a pretty simple entry to represent a debt owed to the user's family. Since it is to their family, the rate isn't necessary. Therefore the user can wait 3 years to pay it off without any financial repercussions.


-
Down-payment On Car
This is an example of a one-time expense of $1,400 (since both start/end date are the same).
-
Car replace ~7 years
This is here to replace an endless cycle of adding cars as assets/debts every 7 years or so. Since the user expects to pay ~$8,400 for every car they buy (after trade-in of old car) it equates to a $1,200 expense every year.
-
Living Costs Upgrade
You could just add a higher rate to the living costs entries, but that isn't always as nice as seeing a nice chunk upgrade. It can also be easier to plan ahead when you make upgrades like this.
-
Fun Money Upgrade
Since the user's debts are all paid off after only a few years following college, they can easily afford an upgrade to their fun money.
-
Emergency Fund
This is just here to show that the user might need to spend ~$2,000 a year on emergencies that pop up. Yes, it would technically still be an asset since they don't always expect to pay it, but they can't rely on it as such. Thus, it is considered money lost to an expense.
Still not enough help?
Check me out on Youtube for some helpful advice.
